Transcript
[0:00] It's obvious to me, but may not be
[0:02] obvious to the media or other people who
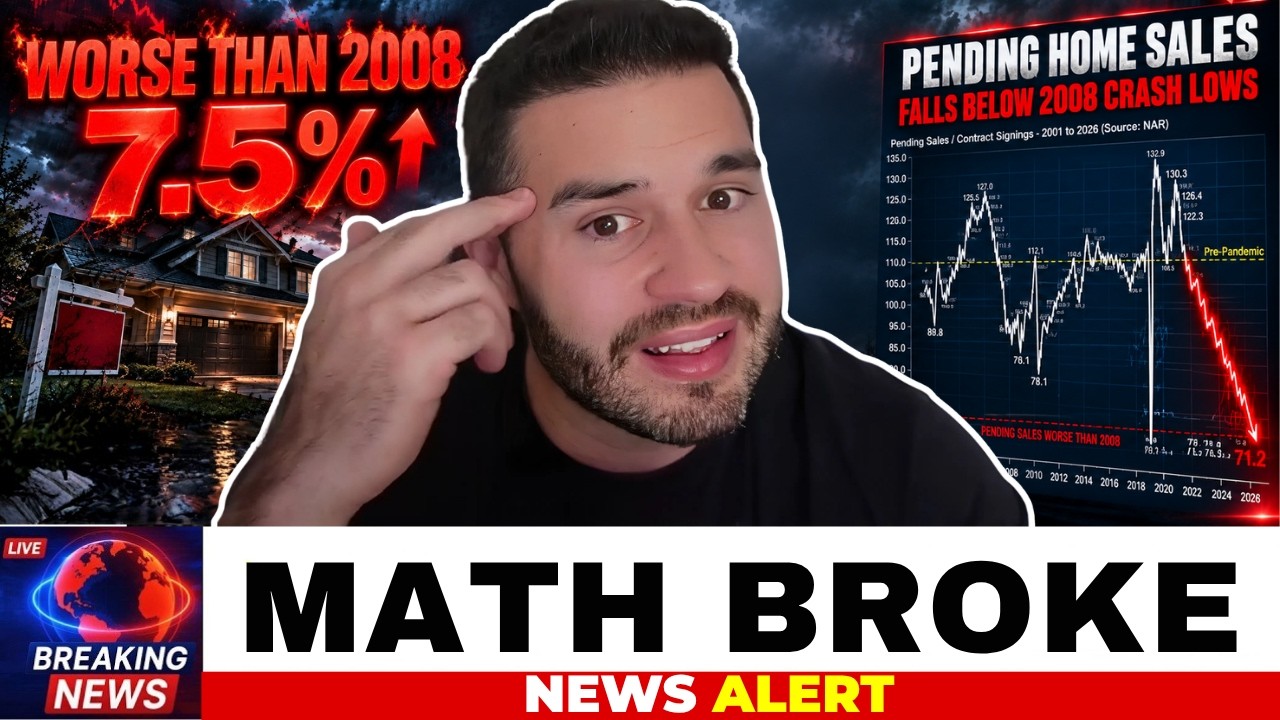
[0:03] aren't paying attention, but it is worse
[0:05] than 2008 from a housing perspective,
[0:08] especially in Florida and Texas, and
[0:09] it's just a matter of time before it
[0:11] impacts your state, too. Comment below
[0:13] where you're at. We're going to dig into
[0:14] some awesome data today that's going to
[0:16] give you everything you need to know
[0:18] about the housing situation here in the
[0:20] United States and in specific areas of
[0:22] the country that's going to make a big
[0:24] difference for you and your family. So,
[0:25] let's jump in. Now, everybody says it's
[0:27] not it's way different than it was
[0:28] before. Yes, it is way different in the
[0:31] fact that it's worse than the 2003 to
[0:34] 2008 runup. So, here's two charts of the
[0:36] median sale price of houses sold in the
[0:38] United States. This one's from 2003 to
[0:40] 2008. This other one's from 2020 to
[0:43] 2025. Obviously, they kind of rhyme with
[0:46] each other. They're not perfect, but
[0:48] people keep saying it's really
[0:49] different. Everything is completely
[0:50] different. The setup's not the same.
[0:52] Well, let's dig into the actual numbers.
[0:54] Here we go. Here's the comparison of why
[0:56] it's worse. the US housing and economic
[0:58] comparison. So, let's look at June 2006.
[1:01] The median home sales price was
[1:03] $246,000.
[1:05] Today, it's $416,000,
[1:08] which is wild. The 30-year fixed
[1:10] mortgage rates are pretty similar,
[1:12] actually, between these two periods.
[1:13] Home ownership rate is, you know, it's
[1:16] gone down just quite a little bit. Maybe
[1:17] that extra 3% picked up was the
[1:19] institutional investors. Housing
[1:22] inventory month supply, it was 6.8
[1:24] months, so it took longer. But right
[1:25] now, we're seeing rapid amount of
[1:27] inventory coming onto the market and
[1:29] we're still at 4.4 month supply. Here
[1:31] locally in Jacksonville, we're pushing
[1:33] six, seven, eight month supply. I mean,
[1:35] it gets worse every single day.
[1:36] Foreclosure rate 1% in 2006 versus 49%
[1:42] of loans. Well, why is this? They
[1:43] haven't been foreclosing on loans for
[1:46] the last few years because of FHA, VA,
[1:49] you know, loan loss mitigation programs.
[1:51] Even for conventional loans, they're not
[1:53] foreclosing on them. And that will start
[1:55] coming through at uh the next end of the
[1:57] year, next few months here. So then
[1:59] positive equity position. This is what
[2:01] gets me. A lot of people say, "Well,
[2:02] there's so much equity in these homes,
[2:04] right?" Well, equity can quickly
[2:06] evaporate in a lot of situations. So 90
[2:09] to 95% of mortgage holders in June 2006
[2:12] had a positive equity position. 98% of
[2:15] mortgage holders in June 2025, so very
[2:18] similar mortgage loan delinquency. We
[2:20] just talked about the delinquency.
[2:21] They've actually it's gotten so bad on
[2:23] the FHA side that they stopped reporting
[2:25] the data back in February. Unemployment
[2:28] rate 4.6% in June. We're starting to see
[2:31] unemployment creep up here in June 2025.
[2:34] Bankruptcy filings are low um today
[2:37] versus that time period, but we're
[2:38] starting to see more bankruptcy filings
[2:40] come through. And a percentage of homes
[2:43] own free and clear, 32% versus 38%.
[2:46] That's great and I'm wonderful to see
[2:48] it. That doesn't mean they won't see
[2:49] distress out there. five-year equity
[2:51] runup before each peak. The median price
[2:53] growth was 38% 179 to 246 and now it's
[2:59] 317 to 416 which is 32%. So we obviously
[3:02] saw a massive run up and then the home
[3:05] price to income growth. So this is you
[3:07] know 3.2 to 4.7 and 4.0 to 5.6. The gain
[3:12] in equity drivers really important right
[3:15] we had easy credit back in the day and
[3:17] speculations. There's the stories of,
[3:19] you know, the strippers being able to
[3:20] buy three or four houses, the ninja
[3:22] loans, the no income, no job type of
[3:24] loans just to get those collection of
[3:26] the fees from mortgage brokers and real
[3:28] estate agents. It's ridiculous. Equity
[3:30] gain drivers this time was that there
[3:33] was massive stimulus, zero interest rate
[3:35] policy for a couple of years, cheap,
[3:37] cheap debt that people could buy and
[3:39] then speculation 2.0. I cannot tell you
[3:42] how many people are speculating on this
[3:44] real estate market either between the
[3:46] Airbnbs or the single family rentals
[3:48] where people, you know, were going out
[3:50] buying four, five, six, seven, eight
[3:51] homes, turning them into rentals,
[3:53] getting a little bit of cash flow. The
[3:54] ones who are holding them now are
[3:55] absolutely regretting that they didn't
[3:57] sell last year and they're basically
[3:59] holding an asset that has increased
[4:01] costs on the rentals, right? insurance,
[4:03] taxes, all of that, repair costs, and
[4:06] they're stuck in these properties
[4:07] because it's an illquid thing, and it's
[4:09] it's expensive to sell real estate,
[4:10] right? It costs 6 to 8% once you look at
[4:12] all the closing costs and the real
[4:14] estate agent fees. So, the equity gain
[4:15] drivers are pretty much similar. The
[4:18] loan quality is different, right? You
[4:19] had stated income before now, but now
[4:21] you have stated occupancy issues where
[4:23] people saying they're occupying them,
[4:24] but they're actually not, and they're
[4:26] using them as an an investment property.
[4:29] And there's studies out there that say
[4:30] 33% of loans out there right now that
[4:32] were originated the past few years were
[4:34] stated occupancy issues where they were
[4:36] basically defrauding the bank saying
[4:38] that they were living in it when they
[4:39] really weren't on the time of closing.
[4:41] So here's I mean here's the thing like
[4:43] you it does not look that different from
[4:46] 2006 and it's much worse than it
[4:49] actually is back then on in in various
[4:52] forms and fashions especially the
[4:54] affordability crisis. So let's look at
[4:56] the main factor. This is number one
[4:58] factor that is makes it completely
[5:00] different. Debt is up for the consumer
[5:03] by 28%.
[5:05] Right? So 2008 peak was 13.8 trillion.
[5:09] 2025 Q1 was 17.7 trillion. This comes
[5:12] from the New York Fed household debt and
[5:14] credit report. The debt type mortgages
[5:17] obviously has 27% increase in the in the
[5:20] amount of debt that they have there.
[5:22] Credit cards is significant. Obviously
[5:24] we see the buy now pay later stuff. Even
[5:26] Costco is starting to do it. It's pretty
[5:27] sad. The consumer is so strapped for
[5:29] cash. Student loan delinquencies, all of
[5:31] that are playing into it. Auto loans up
[5:33] 100%. Wow. Um, student loans up 167%.
[5:39] So, you know, consumers are just getting
[5:40] hurt. That's why the median age of the
[5:42] home buyer today is 38 years old. And
[5:45] usually they're getting money from their
[5:46] parents or an inheritance to be able to
[5:48] purchase. But it's frankly worse, guys.
[5:51] This is way worse than it was in 2008
[5:54] from a debt perspective. And obviously
[5:56] debt is going to impact how much
[5:57] somebody can afford a home. Who can
[5:59] actually buy a home? You ask yourself
[6:01] that question in today's market, right?
[6:03] I bought my house back in 2020 and got a
[6:05] 2.75% rate. My payment is $3,200 and I
[6:09] live in a beautiful country club
[6:11] community. That same house is $200,000
[6:14] higher and the rate is around 7%. Your
[6:17] payment's like 10 $11,000. Who can
[6:20] People don't make that type of money in
[6:22] my city in Jacksonville, Florida.
[6:24] There's very few. You'd have to make
[6:25] three $400,000 to be able to afford a
[6:27] house in my neighborhood. Now, those
[6:29] jobs don't exist here. There's very,
[6:31] very few. So, you wonder who is the
[6:32] actual buyer. They have to come from out
[6:34] of state. Well, if they're not
[6:35] relocating and the people locally have
[6:37] too much debt, there's there's no buyer
[6:39] for it. So, that person's going to be
[6:41] stuck in that house or they're going to
[6:42] have to have a massive price drop on the
[6:45] property by 30 40%. And I know those
[6:48] numbers sound terrifying, but that's
[6:50] where we're seeing things heading right
[6:51] now at this current moment. So, let's
[6:53] jump in because I think it's really
[6:54] important to look at the builders. The
[6:56] builders are a leading indicator.
[6:57] Builders uh put out a ton of data of
[6:59] what's going on with them. So, this is
[7:01] KB Home. They reported yesterday and
[7:03] their share prices are down 20% from the
[7:06] beginning of the year. Here you can see
[7:07] their price chart, but they did actually
[7:09] quite well on earnings because they're
[7:10] diversified from around the country and
[7:12] not every part of the country is doing
[7:13] that bad. It'll eventually spread
[7:15] everywhere as the news gets out. But
[7:17] their major concerns are this. This is
[7:18] what they said. consumer affordability,
[7:20] high mortgage rates, low lower spring
[7:22] demand are the massive issues and KB
[7:25] homes trimmed their fullear guidance due
[7:27] to lighter demand during the spring
[7:29] season. The positives that they said
[7:32] were going on were basically the build
[7:33] time is back to pre2020 numbers. So,
[7:35] they're building properties in 120 days.
[7:37] It's no longer taking them about a year.
[7:39] And maintaining transparency and pricing
[7:41] to buyers. So, when a buyer comes
[7:42] through, they're just telling them
[7:43] straight up, hey, here's the price.
[7:45] Here's what the fees are going to be.
[7:46] Like, they're not doing any tricks or
[7:47] anything like that. They are giving
[7:49] massive incentives to the consumer. And
[7:52] so here's the new price decline from
[7:53] LAR. This is what they reported the
[7:56] other week. So they reported their new
[7:57] home prices declining 24.4%
[8:02] from the peak, which is absolutely wild.
[8:05] And we expect that those declines will
[8:07] come in, you know, even more into the
[8:10] future as more inventory hits the
[8:13] market. And here's the other part of it.
[8:15] Not only are prices coming down, but
[8:16] they have to give sales incentives,
[8:18] right? So, this is, hey, we'll buy down
[8:20] your interest rate by two points, two
[8:23] percentage points. We will pay for your
[8:25] closing cost, things like that to to be
[8:27] able to help them out. And here's the
[8:29] map of pain. So, this is the housing
[8:31] market weakness triggers Lenard to offer
[8:32] their biggest incentives since 2009. So,
[8:34] we're already there. I mean, this is the
[8:36] thing. Like, some people can't even
[8:37] believe that we're even having this
[8:39] conversation, especially people in the
[8:40] northeastern areas that didn't have this
[8:42] spike. But people who are in the cities
[8:44] with that spike in 2020 to 2023, they
[8:48] are just they have to come down. Those
[8:51] prices have to come down. And so new
[8:53] homes are skyrocketing for sale. This is
[8:56] for the whole United States. So we're at
[8:58] November 2005 levels already. My point
[9:01] is this. We are haven't even seen any
[9:04] pain really in the housing market up
[9:06] until this point. Yes, the stocks are
[9:08] done because the projections are moving
[9:10] forward. We're not going to see pain
[9:11] until these foreclosures process
[9:13] through. And so we're going to be seeing
[9:16] skyrocketing inventory from now for a
[9:18] long period of time until prices come
[9:20] down. And this is just for the US. Now,
[9:23] new homes in the south for sale are
[9:25] above the 2008 numbers. It's already
[9:30] worse and we haven't felt the pain yet.
[9:32] This is why we're saying it's going to
[9:33] be worse than 2008. Now, Florida
[9:36] specifically, this is not compared to
[9:38] 2008, but just prior to, you know, the
[9:42] inflation that came through in 2020,
[9:44] 2022. We are now have skyrocketing
[9:47] inventory every single year. It's
[9:49] starting to spike. We expect it to
[9:51] continue to move up as builders finish
[9:53] their pipelines. There's entire
[9:55] communities that are basically sitting
[9:56] vacant at this time. It's the same
[9:57] problem with multif family. They
[9:58] overbuilt multif family. Florida still
[10:00] got a lot of land to develop and
[10:02] builders went wild and they thought that
[10:04] relocations would continue for a long
[10:07] period of time so that way they could
[10:09] continue to build but you know
[10:11] relocations are down 80% from the peak
[10:13] and that's the big issue. Here's the
[10:15] price change by metro. Obviously you can
[10:17] see all areas of the country are doing
[10:20] completely different from each other.
[10:21] This is one year change in metro level
[10:23] home prices between May 2024 and May
[10:26] 2025. You can see obviously Florida and
[10:29] Texas and the South in general is really
[10:31] struggling and the North is doing just
[10:32] fine. They're actually seeing a little
[10:34] bit of price increases. This is why you
[10:36] don't see on the news, hey, we're in a
[10:38] crisis here because not every state
[10:40] right now is in a crisis yet. It's
[10:42] mostly Texas and in Florida. And for a
[10:45] crash to happen, that's a 30% decline in
[10:47] a lot of areas around Florida. We're
[10:49] already down 10 to 15 to 20% depending
[10:51] on where it is and if they're competing
[10:53] with new construction. This is really
[10:55] bad. So existing home sales are as weak
[10:58] today as they are in 2008 and it's
[11:01] hasn't even got started yet. Here you
[11:03] can see the data that came out in 2005.
[11:05] This is May 2005. This is how many
[11:07] monthly existing home sales occurred
[11:09] during that month. So you can see in
[11:11] 2008 it was 403. Right now it's 389. So
[11:14] it's worse than that time period. And we
[11:17] expect it to continue to get worse going
[11:19] into the end of the year. Once we see
[11:20] seasonality hit, we're going to see a
[11:22] massive slowdown. We're telling realtors
[11:24] everywhere, save your cash. Get as many
[11:26] of your sellers sold before August,
[11:27] before school starts, because it's going
[11:30] to be a bloodbath come the end of the
[11:32] year with tons of inventory coming in,
[11:34] demand dropping, and rates are not
[11:37] coming down. Even though you see the
[11:38] 10-year Treasury come down, interest
[11:40] rates are not coming down. So, let's
[11:41] talk about that. Existing home sales are
[11:44] down 40% from the peak. And as you can
[11:47] see, we are at the '08 numbers here. So,
[11:49] just another good way to look at it. So
[11:50] existing home sales are just as bad as
[11:53] we were during the '08 crisis. One of
[11:55] the things that spread the basically the
[11:58] affordability crisis was these
[12:00] institutional investors came in and
[12:02] purchased so many homes from 2012 all
[12:04] the way up till 2022. 36% of those
[12:07] institutional buyers own homes in these
[12:09] six markets, right? Charlotte, Atlanta,
[12:11] Tampa, Houston, Dallas, and Phoenix.
[12:14] These are areas where they can build
[12:15] cookie cutter stuff in the south where
[12:17] people are relocating to. they saw the
[12:19] population growth. Now, in Jacksonville
[12:21] was one of those cities as well. You can
[12:23] see here on the map, the reality is that
[12:25] the institutional buyers stopped buying
[12:28] in 2020 once they saw the interest rates
[12:30] increase. They could no get longer get
[12:32] cheap financing for the properties, make
[12:34] the numbers make sense on paper. And we
[12:37] think if rates continue to move up,
[12:38] obviously that's going to completely
[12:40] slow the market. And I don't see a
[12:43] situation where interest rates would
[12:45] come down because the demand for
[12:46] mortgage back securities is simply not
[12:49] there. And we're we can look into to
[12:52] that data as well. And the biggest
[12:54] issue, we referenced this in the
[12:55] beginning of the video of why it's worse
[12:57] is that the poor just keep getting poor.
[12:59] Their middle class is falling apart. The
[13:01] bottom 50% of Americans share 3% of the
[13:05] wealth. These wealth numbers are just
[13:09] mind-boggling. Or do you guys see it
[13:10] too? comment below like like all the
[13:12] money is going to the top. And this is
[13:14] why trickle down economics, you know, it
[13:17] works a little but not enough. It
[13:18] doesn't make it to the people who need
[13:20] it at the bottom. So there's 166 million
[13:23] Americans that, you know, share this
[13:24] percentage of the wealth. I also saw
[13:26] that the average 50-year-old's net worth
[13:28] is like $56,000. So there's no way
[13:30] there's no path for them at this point
[13:32] in their career and life to save enough
[13:34] money to be able to retire. They're
[13:36] going to have to work the rest of their
[13:38] life. And this is a problem. And
[13:40] obviously if you can't make the housing
[13:41] payments, which you know 20 to 30% of
[13:44] the money that's coming in goes straight
[13:45] to the housing payment. If housing
[13:47] payments don't come down, then they're
[13:48] really not going to be able to build
[13:49] wealth. It's now frankly cheaper to rent
[13:53] right now. So I have friends coming to
[13:54] me, John, I want to buy this house. I
[13:55] want to buy this house. I tell them,
[13:57] wait until the end of the year. You
[13:58] really need to negotiate. You need a top
[14:00] agent in your marketplace to be able to
[14:02] help you be strategic because if you buy
[14:03] at the wrong time, you could be stuck
[14:05] with that thing for a long period of
[14:06] time. No one wants to lose money. I
[14:08] mean, you could lose be losing one to
[14:09] two years worth of salaries. And I'm
[14:11] talking people out of buying right now
[14:12] and and to wait and to to be careful.
[14:15] Now, if you need somebody to help you in
[14:17] your market, let reach out to me. You
[14:19] can look at my email and the notes, make
[14:20] a comment, and I'll reach out to you. I
[14:22] can connect you with others. I've done
[14:24] that many times already since starting
[14:25] this YouTube channel. So, I appreciate
[14:27] you guys reaching out. Happy to help.
[14:29] But buying a home in 2025 costs 43% more
[14:33] than renting one. And rents are now
[14:35] coming down, which is wild. So, the
[14:37] premium for home ownership has been
[14:38] elevated for three years straight and
[14:40] now it's looking to to change.
[14:42] Hopefully, that comes down pretty soon.
[14:44] And a lot of builders, what they're
[14:46] doing is they're selling their inventory
[14:47] just to have them turned over as rentals
[14:50] because they have to find some way to
[14:51] get cash flow off of the property
[14:53] because they a lot of them have debt
[14:55] backing it. Their taxes obviously is
[14:57] starting to depreciate. They need to be
[14:59] taken care of. They're not taking care
[15:00] of the lawns and things like that. But
[15:01] it is frankly for consumers it's cheaper
[15:04] to rent now than to buy.
[15:07] This is the federal funds effective
[15:09] rate. So everybody in the world thought
[15:11] they were so smart and so successful by
[15:14] buying real estate and holding it for a
[15:16] long period of time. What actually
[15:17] happened was that interest rates came
[15:20] down for a 40-year period. And now
[15:23] they're reverting back to the mean which
[15:25] is frankly even higher than it is today
[15:28] probably eight or nine%. and they're
[15:30] saying, "What the Fed, what is the Fed
[15:32] doing? They're going to collapse the
[15:32] economy. They're raising interest
[15:34] rates." We've been lowering interest
[15:36] rates from all the way up to like 18%,
[15:39] you know, all the way down to zero. And
[15:41] we've had that period, look at this,
[15:43] like to zero. Zero interest rate policy.
[15:46] Obviously, that's going to inflate every
[15:47] single asset that is purchased. So,
[15:49] everybody looks like they're geniuses,
[15:50] but the reality is the Fed just bailed
[15:52] out everybody who owns assets during
[15:54] tough periods of time. And we'll
[15:56] probably continue to see this cycle
[15:58] continue as the dollar basically becomes
[16:00] worth nothing. I read somewhere that the
[16:03] dollar is worth 24% less since 2020
[16:06] already. And that those numbers are
[16:08] quite staggering. And everyone thought
[16:09] they were geniuses. This is the interest
[16:11] rates coming down. Right? Here's the
[16:13] 30-year fixed mortgage rate 1971 to
[16:17] present. And you can see just rates
[16:19] dropping, dropping, dropping, dropping,
[16:21] dropping. And then obviously rates
[16:22] coming up and prices start coming down.
[16:25] Everything in real estate is a function
[16:26] of payment. So if if the payment goes
[16:29] up, then it makes it not like it just
[16:31] lowers your buyer pool. And if there's
[16:33] more inventory because the builders are
[16:35] building, then you have a you have a
[16:37] double whammy in that situation.
[16:39] Frankly, 60% of people are unable to
[16:42] afford a house under three over
[16:44] $300,000, which is crazy to me. So this
[16:47] is the median price home in 2025 is
[16:50] 459,826.
[16:54] So that's a lot of people being unable
[16:57] to purchase. So we don't have a
[16:59] inventory problem. We have an
[17:00] affordability problem and we're not
[17:03] building inventory under $300,000 in a
[17:05] lot of cases or in areas that have a
[17:07] median income that's going to be able to
[17:09] support $300,000. Here's the payment.
[17:12] This chart is mind-boggling. Back in the
[17:15] day it was, you know, 1,500. Back in
[17:17] 2020, it was $1,500 for your housing
[17:20] payment for a median price home. And now
[17:23] it's 2,800. So $1,300 spread in just 5
[17:27] years. For a lot of people, that's
[17:29] almost double, right? You know, I was
[17:31] looking at one of the apartments that I
[17:32] rented, you know, even a decade ago, and
[17:34] it's it's up 80 90%. I don't know how
[17:37] people graduating from college will be
[17:38] able to rent even. It's kind of
[17:40] terrifying. And the pay is not keeping
[17:43] up with productivity. So we're seeing a
[17:44] ton of productivity gains for employees,
[17:47] but the hourly pay is only up 32%. So
[17:50] people are more productive. A lot of
[17:52] people are working longer after hours
[17:53] due to technology, but the hourly pay
[17:55] has been lagging. So productivity has
[17:57] grown 2.7 as much as compensation for
[18:00] workers. So basically the way you can
[18:02] think about it is one-third of the gains
[18:03] go to the worker and 2/3 of the gains go
[18:05] to the business. And so that's just how
[18:08] it is. And unfortunately that's going to
[18:10] impact housing if people aren't paid as
[18:12] much. Home price to median income ratio.
[18:15] This is why it's worse. It's all the way
[18:18] past the housing bubble when you look at
[18:20] it from a household income ratio
[18:21] perspective. So guys, things are already
[18:23] worse and it's getting worse every
[18:25] single week that we're tracking this
[18:26] data. And the educated unemployment is
[18:28] going up. Obviously, employment is going
[18:29] to be a big factor for first-time home
[18:31] buyers. For these uh educated folks
[18:34] here, ages 20 to 24, 25 to 34, and 35 to
[18:38] 44. The unemployment is starting to move
[18:40] up a little bit after this spike during
[18:43] those years. Now, jobless claims are
[18:45] also moving up. So this is from 2022,
[18:47] right? We had it we had it come down a
[18:49] lot and now it's starting to move up
[18:50] very quickly. So this is the highest
[18:52] since November 2021, the US continued
[18:55] jobless claims four-week moving average.
[18:57] We expect there to be more job loss
[18:59] coming through. Powell came out today
[19:01] and said that he is not have any plan to
[19:03] reduce the rates. Basically, you know,
[19:05] he does not see this impacting housing
[19:07] supply in the future and things need to
[19:09] revert back to normal. So, at least
[19:11] until May of next year, as long as Pal's
[19:13] in charge, it's likely that he's not
[19:14] going to do any favors for housing. And
[19:15] then, frankly, even if the Fed funds
[19:18] rate is reduced, that does not mean that
[19:20] the there's going to be more demand for
[19:22] mortgage back securities and that
[19:24] mortgage rates will come down. The Fed
[19:26] is not going out there right now and
[19:27] buying a massive amount of mortgage back
[19:29] securities to help the housing market.
[19:31] They're letting it collapse as shelter
[19:33] is the one number one factor in
[19:35] component for, you know, inflation. So
[19:38] the job issues continue to get worse. So
[19:40] it's deteriorating. Permanent job losers
[19:42] reached 1.92 million in May, the highest
[19:45] in four years. The number of people
[19:47] receiving unemployment benefits was the
[19:49] most in four years and both have been
[19:50] consistently rising over the last three
[19:52] years. The other thing that's getting
[19:54] which is interesting is the banks are
[19:56] tightening lendered stand lending
[19:57] standards. This comes from Braavos
[19:59] Research. Uh banks are tightening
[20:01] lending standards on the rise again. and
[20:03] tighter credit conditions would be a big
[20:05] headwind for the economy and the stock
[20:06] market and really for for real estate as
[20:09] well. And demand is waning for the MBS.
[20:12] As I noted, mortgage rates rose 1% in
[20:15] the last time the Fed delivered a series
[20:17] of rate cuts. So, we are no longer
[20:19] correlating with the Fed funds rate.
[20:21] Right? People don't want to put their
[20:23] money back in housing when we have all
[20:25] these headwinds in the way, but they're
[20:27] fine with reducing the Fed funds rate,
[20:28] which is basically the overnight
[20:30] borrowing rate for the banks. And where
[20:32] there's speculation, now there's pain.
[20:34] So, this is the one-year change in home
[20:36] prices at America's largest 50 metros
[20:38] between May 2024 and May 2025. The
[20:41] highest concentration of institutional
[20:44] investors, right? Tampa, Dallas,
[20:45] Phoenix, Atlanta, Houston, Charlotte,
[20:47] just like we saw in that chart. Here's
[20:49] Jacksonville. These are the areas that
[20:51] will likely get hit the hardest. And
[20:54] this I think this chart basically
[20:55] summarizes it all where the areas where
[20:57] there was massive speculation of house
[20:59] prices are now starting to fall. The
[21:01] areas that did not have that massive
[21:03] spike in appreciation, they're just
[21:05] getting the regular 4% 3% trend line and
[21:08] people are still able to purchase
[21:10] because the prices did not go up that
[21:12] much. So it was a speculative bubble
[21:14] caused again by the Fed's policies of
[21:16] zero interest rates and closed sales.
[21:18] You know, it's worse than it was in
[21:20] 2008. Just to kind of compare to 2019
[21:22] before the 2020 period, basically, you
[21:25] know, in Jacksonville, we're down 22.8%
[21:29] in the number of closed sales versus
[21:31] 2019. 2019, I thought there was going to
[21:33] be a recession and I think we were
[21:35] headed into one. And then, you know, it
[21:38] just totally spiked with what interest
[21:40] rates did. Again, housing is a function
[21:42] of payment. And part of that, the
[21:44] biggest part of that is really what's
[21:46] your interest rate? Where are m
[21:47] Americans moving from in 2024? This is
[21:51] pretty interesting. And I see that
[21:53] people are still moving to Texas and
[21:54] Florida, even South Carolina. Look at
[21:57] that. And people are leaving the north
[21:58] in the west to go to these lowerc cost
[22:01] areas. But the reality is in 2025, we're
[22:04] starting to see this really slow down.
[22:05] The number of relocations are drastic.
[22:08] We see the number. We can tell this by
[22:10] the amount of people who click on
[22:11] Zillow. Leads are down like 50% from the
[22:15] years prior because what do you do if
[22:16] you're out of town? You got to click on
[22:17] Zillow. You don't know a local realtor.
[22:19] And so, you're going to go find somebody
[22:21] on that website or some of the other
[22:22] websites. The leads are down very, very
[22:25] drastically and Zillow is hurting from
[22:27] that. So, with that, look, what we want
[22:29] to do is we want to have a long-term
[22:31] focus. You know, down markets where the
[22:33] foundation is set during the next
[22:34] upturn. partner with the best people out
[22:37] there in the marketplace. Grit is the
[22:38] key. Get the information that you need.
[22:40] Comment below. What do you guys see
[22:42] happening in your market? Do you expect
[22:44] this to be worse than '08? I certainly
[22:45] do. In a lot of ways, this is already
[22:48] worse than 2008. Comment below. Is it
[22:51] worse than 2008 in your market? I think
[22:53] it's going to be different for each one
[22:54] of us, but I can tell you in Florida, it
[22:56] is going to be an absolute blood bath. I
[22:58] can absolutely see prices coming down 30
[23:01] to 40% from here. Thanks so much for
[23:03] following. If you want more notes,
[23:04] subscribe to my Substack. The I share
[23:07] stuff in there that I can't share on
[23:08] here just because of the algorithm. So,
[23:10] reach out to me and happy to get you
[23:12] connected into our system. See you guys
[23:13] later.